
PORTLAND, Ore. — Within the last decade, climate change has brought consistently hotter summers to the Portland metro area, producing new temperature records and causing multiple deaths. It's been a difficult adjustment for a historically temperate region, where many older homes and apartments don't come equipped with air conditioning.
And heat doesn't impact all neighborhoods in the tri-county area equally. Officials have previously identified a few "heat islands" — areas with sparse tree canopy and expansive areas of pavement that offer little shade and absorb more of the sun's rays.
With that in mind, the governments of Multnomah, Washington and Clackamas counties embarked last year on a heat mapping project, intended to help leaders and the public better understand where the hot spots are.
Throughout the day on July 22 of last year, 125 volunteers roamed the tri-county area with special equipment attached to their cars, capturing more than 269,000 temperature readings as they visited each neighborhood.
The idea isn't entirely new. Last year, the National Oceanic and Atmospheric Administration selected Washington County as one of 14 sites for its latest study on heat islands across the U.S., a project that's been ongoing for eight years now. But the tri-county project marks the largest single study in the world to date, covering an area of over 400 square miles.
“As climate change continues to affect our local communities in new ways, we must continually review our response and look at data at the neighborhood level to make sure our vulnerable communities are protected,” said Brendon Haggerty, Multnomah County’s Healthy Homes and Communities program manager. “This study is a powerful tool for protecting public health — it’s a great example of how public health measures risks so that we can all work together to reduce climate impacts.”
What the study found
Some of the results will not be surprising. Areas with more pavement and concrete buildings protected by fewer trees stood out. Those tended to be suburban areas near highways — but urban residential areas, particularly in east Multnomah County, were not immune.

According to a statement from the three county governments, the National Weather Service recorded a high on July 22 of 89 degrees at the Portland International Airport — itself something of a heat island. But temperatures recorded in the Tualatin area were almost six degrees warmer.
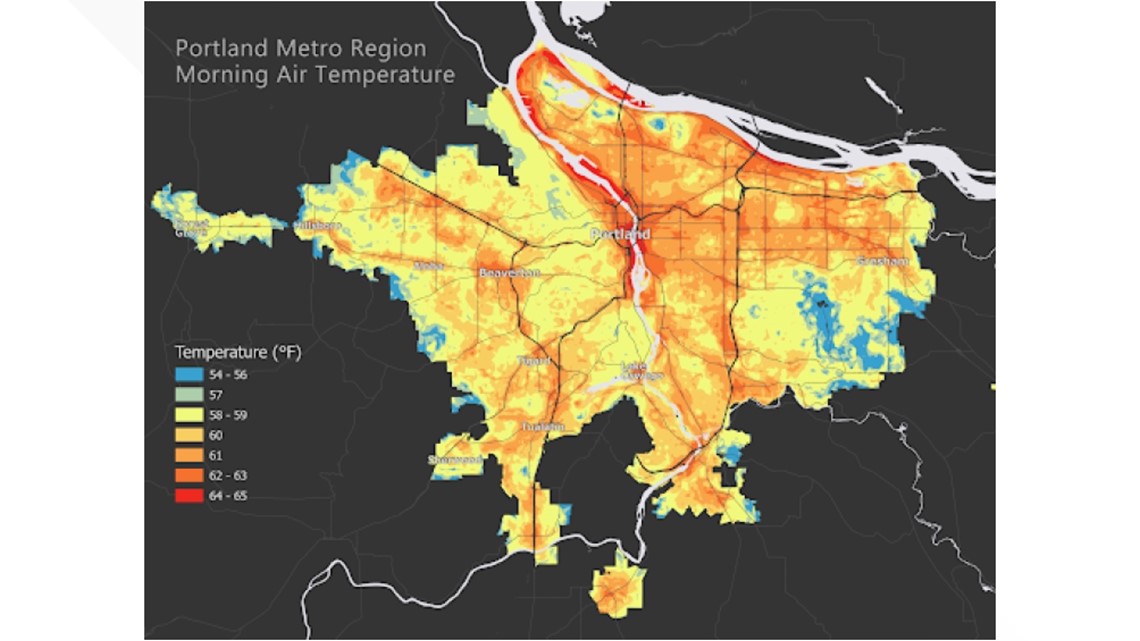
Results were split into the morning, afternoon and evening periods, and the tri-county heat readings produced highs of 65.3 degrees, 94.6 degrees and 92.1 degrees, respectively.

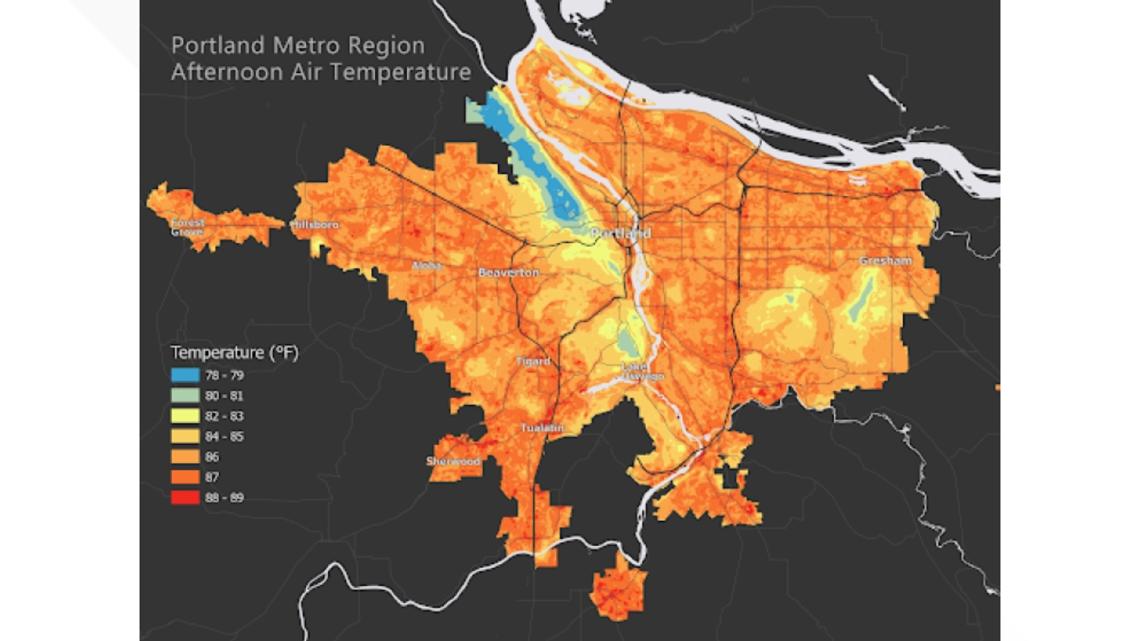
However, some areas were significantly cooler. Around Forest Park, near Lake Oswego and around the Lewis & Clark College campus, readings came in at 50.5 degrees in the morning, 77.4 degrees in the afternoon, and 74.4 degrees in the evening.
"There was a 17.2-degree Fahrenheit difference between the hottest and coolest places across the Portland metro region, which occurred during the afternoon data collection, and is the difference between the hottest recorded temperature and coolest during that time period," county officials said.


In Multnomah County, heat mapping identified Lents, the Mall 205 area and industrial spots near the Portland International Airport as being the hottest. The cities of Wood Village, Maywood Park and Fairview also stood out.
Washington County's hottest area included parts of Sherwood, Tualatin and Cornelius.
Finally, Clackamas County showed hot spots in Molalla, Canby and Wilsonville.
An interactive map of heat zones can be found here. View the full report here or a summary here.
County officials pledged to use this information to inform their human services, land use, urban planning and infrastructure design, updating their climate adaptation plans and their plans for an emergency response to extreme heat. The counties also framed it as an opportunity for the public to be better prepared for heat waves.
“I want people who find their homes and workplaces in hotter areas to feel empowered to use this information to prepare and adapt,” said Dr. Sarah Present, Clackamas County’s Health Officer. “People can better understand their personal risks and make a plan for hot summer days. People can also take small steps with their neighborhoods, employers and local government to cool these areas down over time. Fortunately, we still have time to make changes in our communities today to help us adapt to a warmer future.”
Last month, staff from Multnomah County, the city of Gresham and the nonprofit Friends of Trees held a tree-planting ceremony in honor of the people who died during 2021's heat dome. In Multnomah County alone, 72 people lost their lives to the heat.
Heat waves in 2022 and 2023 also resulted in deaths, although significantly fewer than during the record-breaking heat of 2021.