

PORTLAND, Ore. — As Oregon faces a surge in coronavirus cases, new modeling suggests there could be plenty of more days with at least 100 new cases, if not more.
Researchers for the Institute for Disease Modeling (IDM), based in Bellevue, Wash., say it’s still too early to determine the full scope of why cases have surged over the past few weeks, but recent data appears to show transmission has increased by at least 10 percentage points since gradual reopening in Oregon began on May 15.
The concern over the spike in COVID-19 cases led Gov. Kate Brown, in consultation with state health officials, to pause all county reopening plans for at least a week, including Multnomah County’s Phase 1 application.
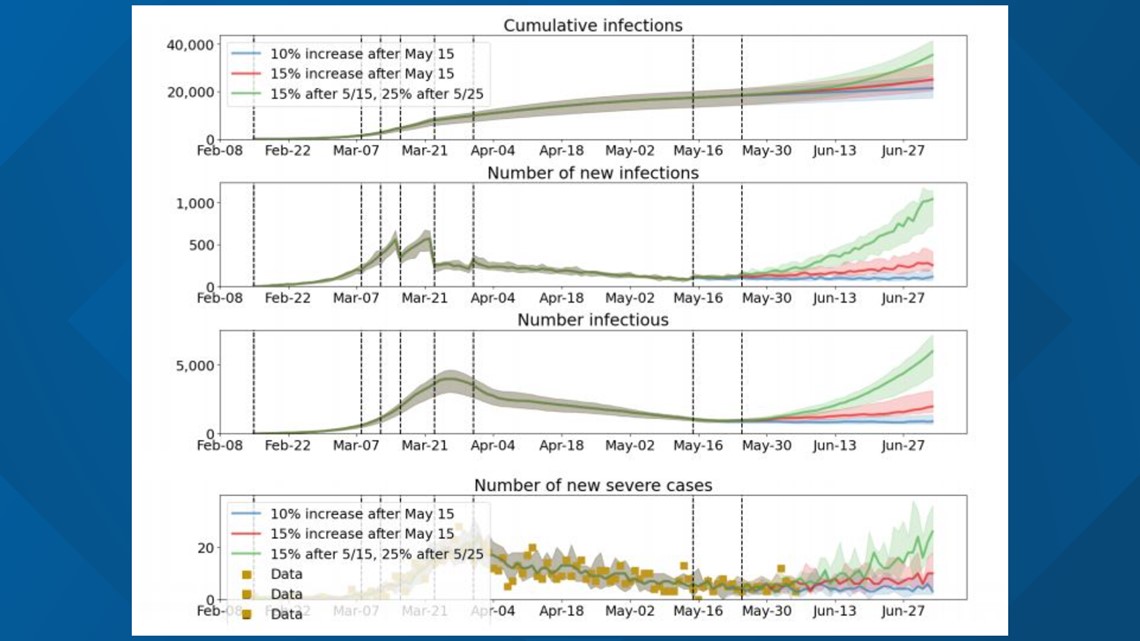
The IDM models, which the Oregon Health Authority uses for data analysis and planning purposes, were released on Friday. They project three different scenarios based on varying transmission rates. Here’s a breakdown of the three models:
Most optimistic:
- This model assumes a 10-percentage point increase in transmission after reopening on May 15. This model fits hospitalization trends in late May, according to IDM. It assumes an increase in hospitalizations over the most recent days of available data, June 2-4, was only a temporary increase.
- Under this projection, the number of new infections per day will remain relatively stable over the next month.
Less optimistic:
- This model assumes a slightly larger increase in transmission, 15 percentage points, after May 15, which fits the most recent hospitalization and diagnoses trends better, IDM says.
- Under this projection, the number of new infections per day gradually increases over the next month to about 170 additional new cases per day.
- This projection appears to back up a statement Dr. Dean Sidelinger, the OHA epidemiologist, made during a news conference on Friday. Sidelinger said Oregon could continue to see an upward trend in cases, with perhaps 230 new daily cases in early July.
Most pessimistic:
- This model assumes a 15-percentage point increase in transmission after May 15, as in the “less optimistic” scenario, plus an additional 10 percentage point increase in transmission after May 25. This model assumes the recent increase in the number of new cases reflects increased transmission, rather than increased testing.
- Under this projection, new infections per day would increase more dramatically. This model projects that by July 3, there would be about 14,000 more total infections compared to the “most optimistic” model (35,400 vs. 21,400), 925 more new infections per day (1,040 vs. 115) and 17 more new severe cases per day (22 vs. 5).

Over the last six days, Oregon has reported its four highest daily totals of new COVID-19 cases during the pandemic, the most being when 178 new cases were reported on Thursday. This comes after the Oregon Health Authority reported a 75% increase in cases for the week of June 1-7 compared to the week prior. There has been a total of 5,337 known coronavirus cases in Oregon during the pandemic, including 173 people who have died.
Like the IDM researchers, the OHA said it’s still too early to nail down what exactly has contributed to the increase of cases but has said several factors, from the state’s partial reopening to workplace outbreaks to increased testing and contact tracing, could be playing a role.
IDM said hospitalizations typically follow new infections by about 12 days. Under that reasoning, researchers expected the effects of reopening would potentially first be seen on May 27. That timeline goes into June when considering Clackamas and Washington counties, the two most populated that have reopened, entered Phase 1 on May 23 and June 1, respectively.
IDM said it’s too early to assess the effects of recent protests for Black Lives Matter, which began in Oregon around May 28. The COVID-19 data available for modeling includes only a week after the mass demonstrations began.
Prior to reopening, the measures Gov. Brown and the state took “dramatically reduced the burden of COVID-19 in Oregon,” according to researchers. They said there was a dramatic reduction in transmission by March 31 and the number of new daily cases declined through mid-May. But those restrictions led to a severe economic downfall that includes the projected loss of $10.5 billion for the state, and hundreds of thousands of Oregonians out of work, many of whom were unable to get unemployment benefits in a timely matter and some who are still waiting months into the pandemic.
In a press conference Friday, Brown expressed frustration with deciding to put the state’s reopening plan on hold but said "when it comes to the health and safety of Oregonians, the buck stops here."